To be able to value certain aspects of structural quality, STAN also computes several
metrics. A metric is simply a function mapping artifacts of some kind to numbers.
 A metric computation can be as simple as counting the number of classes in a package or
as complex as determining the average component dependency in the package dependency graph.
A metric computation can be as simple as counting the number of classes in a package or
as complex as determining the average component dependency in the package dependency graph.
STAN’s aim is not to be a mass metrics tool. There are hundreds of metrics that could be computed quite easily, but who really wants to see them all?
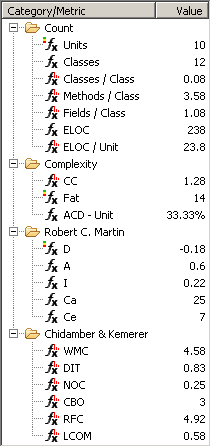
STAN currently supports
- Several counting metrics
- Estimated Lines of Code
- McCabe’s Cyclomatic Complexity
- Average Component Dependency (ACD), Fat and Tangled
- Metrics by Robert C. Martin
- Metrics by Chidamber & Kemerer
Metrics are collected into categories. A whole category at once as well as individual metrics can be enabled or disabled.
 Where it makes sense, STAN promotes metric averages and distributions from lower level
to higher level artifacts. Selecting such a metric on a higher level artifact will show
the distribution as a bar chart.
Where it makes sense, STAN promotes metric averages and distributions from lower level
to higher level artifacts. Selecting such a metric on a higher level artifact will show
the distribution as a bar chart.
Ratings
When it comes to assessment, metric thresholds are needed to let the user define the boundaries between acceptable and unacceptable metric values. However, a single threshold may not provide us with the granularity desired for certain metrics.
For example, we might want to say, a value for a method’s lines of code up to 30 is perfect, up to 60 is still fine, up to 120 is critical, above 120 is really bad and 240 is the worst we can imagine.
 STAN provides what we call Traffic Light Ratings, partitioning the value range into
green, amber and red subranges. Back to our example, 70 lines of code is better than 110.
So, even if both values fall into the amber range, they will be rated differently.
STAN provides what we call Traffic Light Ratings, partitioning the value range into
green, amber and red subranges. Back to our example, 70 lines of code is better than 110.
So, even if both values fall into the amber range, they will be rated differently.
STAN comes with a reasonable set of default ratings. However, ratings can be added, removed and adjusted easily. Furthermore, the current settings can be exported and imported. This allows to share preferences with others or to switch between multiple profiles.
Violations
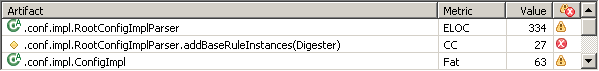
An artifact is said to violate a metric if it is rated amber or red for that metric. For each artifact, STAN shows you all metrics that are violated by the artifact itself or by contained artifacts.
To take further profit of our ratings, we can use them to rank metric violations. However, simply sorting by rating isn’t good enough. What we need is a measure for relevance.
STAN assumes that violations at “big” artifacts are worse than violations at “small” ones: it should be more relevant if a package received a bad rating for some metric A than if one of its 42 classes received a similar rating for some metric B. Moreover, even if a package is rated amber for A, this might be more relevant than if one of its classes is rated red for B.
To take this into account, STAN prioritizes a metric violation by weighting its rating with the amount of the artifact’s underlying code. The result is shown in the Violations View.
Finally, for a given artifact, we might want to get a feeling for how metrics contribute to its violations and how badly the artifact is polluted by violations. STAN’s Pollution Chart shows us exactly this.

Selecting a slice as shown above filters the Violations View to the corresponding metric.
The wider the ring, the higher the degree of pollution of the underlying code. On the application level, the ring’s thickness can serve as a quick indicator for the overall structural quality of the code base.
Queries
Metric queries allow to track down artifacts that exceed some metric threshold or rating category. You’ll find it convenient to have these artifacts at one place, to browse and investigate them, without loosing scope. For example, the query “Tangled > 0” will give all the package trees with cyclic dependencies between their children:

Double clicking a row will make the corresponding package tree the current artifact, thus showing the tangled graph in the Composition View.
Queries may be defined for any supported metric by specifying a threshold constant (as in the example above). Additionally, queries for rated metrics may be defined to match certain rating categories, I.e. “amber or red” or “red”, thus collecting all artifacts violating the given metric.
Maps
Treemaps are a great tool for space efficient visualization of hierarchical structures. In fact, STAN uses treemaps in several places. The Map View is used to visualize the ratings of artifacts from a hierarchy for a given metric. For example, a map for the Tangled metric will show the package tree hierarchy as nested cells, whose background color reflects the ratings:
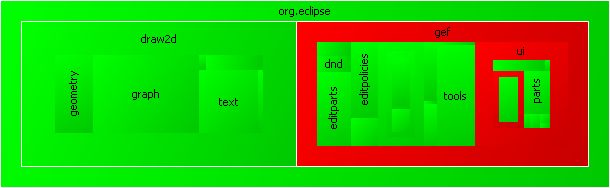
Double clicking a cell will make the corresponding package tree the current artifact, thus showing the tangled graph in the Composition View.